‘When you have two data points, it is very likely that one will be different from the other.’
W Edwards Deming
Random variation affects everyone in everything we do. Take two work days, and the length of our commute will vary by a few minutes. Count calories, and it’s highly unlikely that we’ll consume exactly the same number on two different days. Swim 1500m at two triathlons, and your time will not be the same.
If we plot our data over time, random variation will give us a chart that looks something like this:
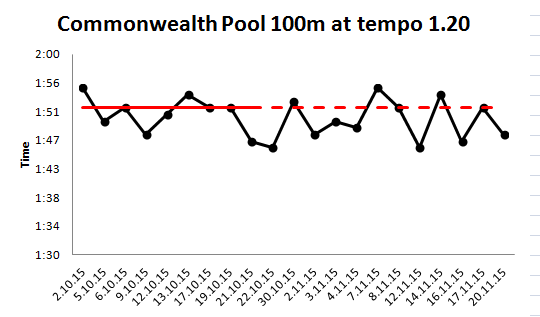
Along the bottom axis, we have the sequence of occasions when we collected data. On the left axis, we have the measure. Here, the measure is time in minutes and seconds.
But our data won’t always look like this. Sometimes we’ll have non-random variation, which arises because of specific circumstances.
The chart below shows times for a series of Susan’s marathons.
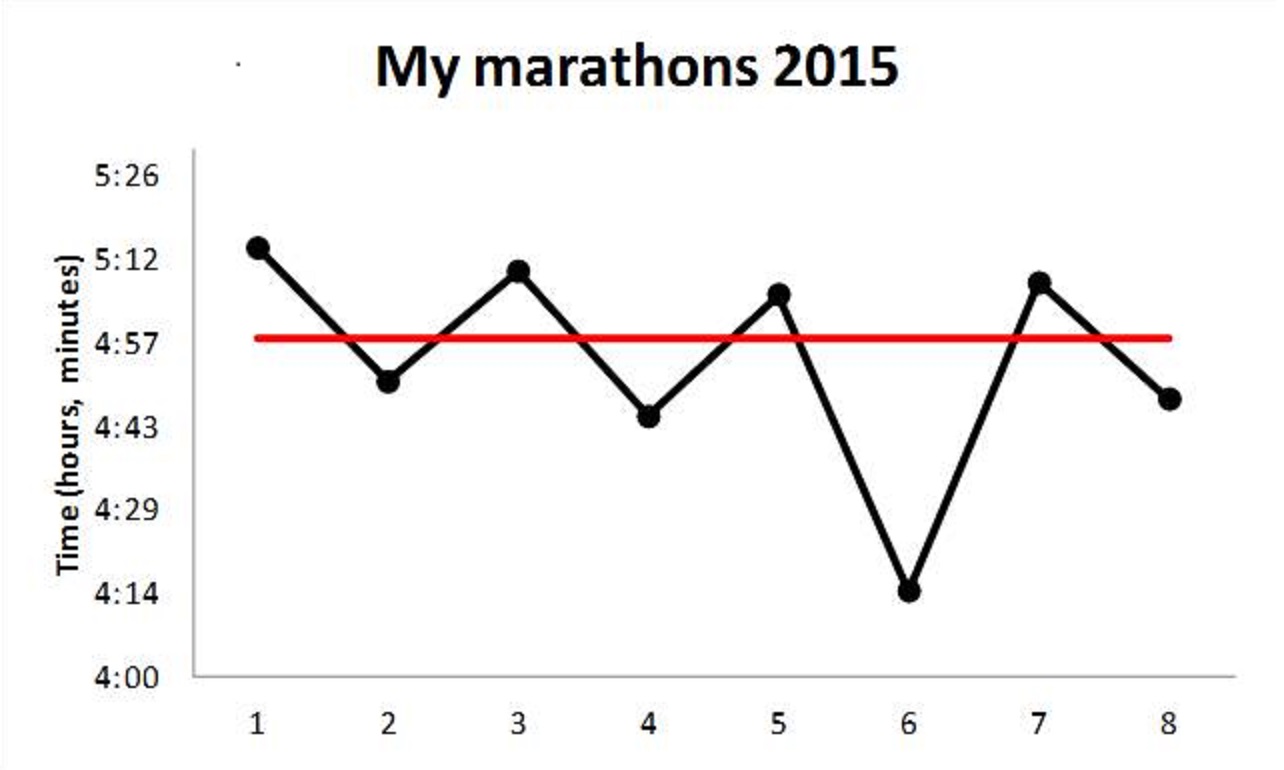 Most of the variation is random, but marathon number 6 is non-random. Susan would want to learn from that, but she can only learn if she has more information about the different events – using dates or venues along the bottom would help, for example. Was marathon number 6 a course that was mainly downhill, or did Susan do something different that helped her to run faster? If so, what was it and how can she get her time down to that level again?
As swimmers, we need to understand whether our data is random or non-random. When it’s non-random, we should investigate to find out why.
- Did I swim more slowly than usual because of something wrong with my technique, or was it because I was out late last night and didn’t get enough sleep?
- Did I swim faster than usual because I’ve finally got my legs to float weightlessly behind me, or was it because the pool was quieter than usual and I swam with total focus, not distracted by other swimmers or buffetted by choppy water?
Most non-random variation isn’t as obvious as Susan’s marathon. Keep an eye on our updates for more on how these charts can help us understand variation.
And in the meantime, have you noticed any obvious non-random variation in your swimming? Comment on what you’ve learned from it below.