
Paul is trying to reduce the number of strokes he swims over 100m. If the tempo of his strokes remains the same while he reduces the number of strokes, he’ll go faster.
He’s more comfortable breathing on the left than on the right, so he’s been working on improving his breathing to the right, on every second stroke. Now he’s decided to try bilateral breathing, taking a breath every third stroke. Based on everything he’s read, he thinks this will keep his body in better balance, so he predicts that he’ll reduce the number of strokes he takes to complete 100m. He swims five times a week, and he’s using a 100m swim with his tempo trainer on 1.20 to test whether he’s improving, so he can decide whether to stick with the bilateral breathing. After four weeks he’s got enough data to work out whether he’s made an improvement.
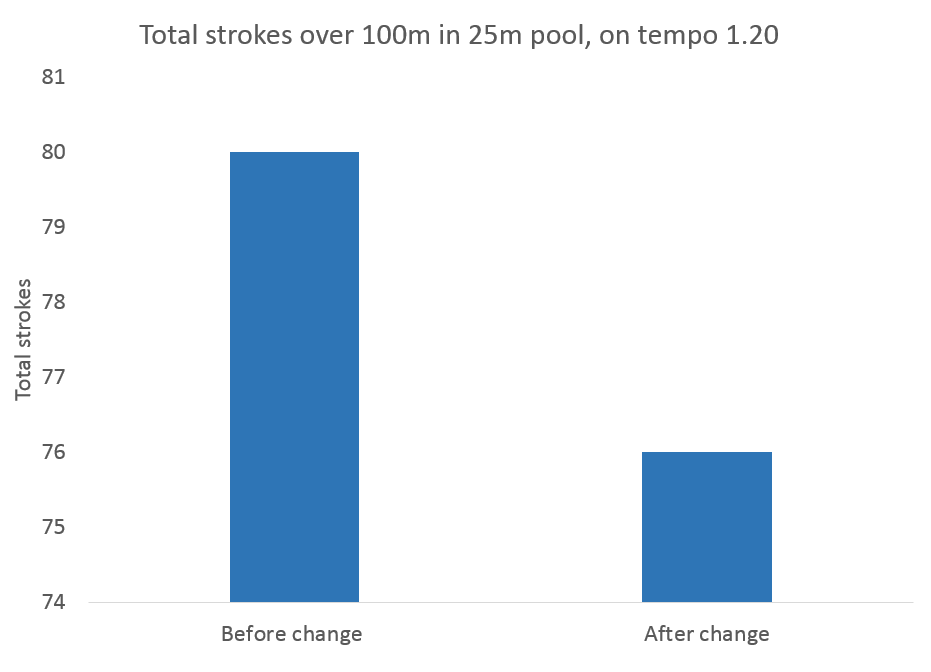 Here’s is Paul’s data in a ‘before and after’ chart. He averaged the data before changing to bilateral breathing, and averaged the data after. According to this chart, Paul’s made a great improvement, from an average of 80 strokes to an average of 76 strokes.
But looking at the data in this way isn’t very helpful. It doesn’t tell us anything about the process. It’s a snapshot, and doesn’t tell us the full story. As Deming says:
‘When you have two data points, it is very likely that one will be different from the other.’
We get more useful information by using a time series chart, where every data point is plotted individually. In the charts below, each data point represents the number of strokes on one specific date.
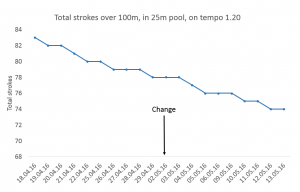 Number of strokes falling anyway

In this chart we can see that the number of strokes wall falling anyway, even before Paul’s change to bilateral breathing. The general direction of the line doesn’t seem to have altered after the change to bilateral breathing, so the bilateral breathing doesn’t seem to have made any difference. Using this time series chart, Paul knows that he needs to investigate what he was doing differently before the change to bilateral breathing.
 Number of strokes fell, then rose again
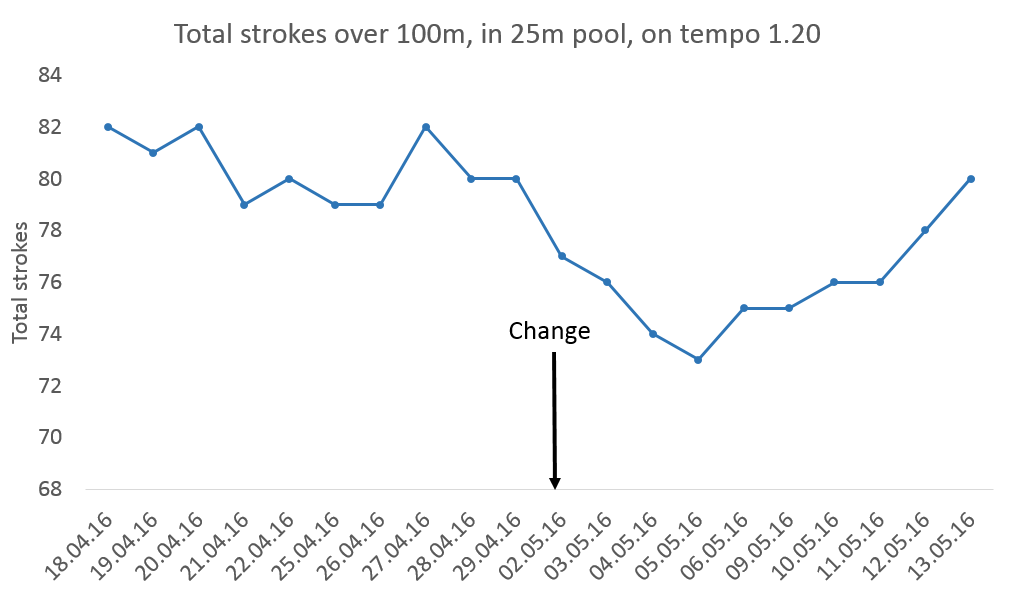
Here the number of strokes did seem to go down associated with the change in breathing pattern, but then it went back up. There is no conclusive evidence about which breathing technique will help reduce the number of strokes. This pattern of data could have a number of causes. For example, it could be that bilateral breathing did help, but Paul wasn’t able to maintain a consistent focus on it after the first few sessions, so didn’t execute it effectively. Or it could be that the bilateral breathing didn’t help, and it was something else that caused the brief reduction in strokes.
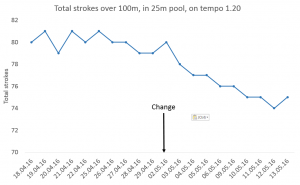 Fall in number of strokes associated with change in breathing

Here Paul’s data is signalling non-random variation: his stroke count has fallen in the period following the change to bilateral breathing. If he has no other data to indicate another cause of this fall in stroke count, it is likely to be due to the bilateral breathing, and he should stick with it.
If we converted any of these time series charts into before and after charts, they would look like the one above. So we wouldn’t know which of these stories is associated with this data – we wouldn’t know whether or not the change made had resulted in an improvement.
There are many other scenarios that would produce that same before and after chart. And if, instead of using an average, we compared just the first data point and the last, this could still mislead.
A time series chart like the ones above is helpful, but to make it even more helpful, and easier to analyse to identify whether the change we have made has resulted in improvement, we apply 4 rules. Look out for details of these rules in future blogs. In the meantime, decide what data you are going to measure regularly so you are ready to learn from it in a time series chart.